 I am pleased to announce version 5 of the free AppV_Manage tool, and in particular the new run-time debugging capabilities. You can find the tool downloader at this link here.
When dealing with a difficult application, you often need to use several tools to try to find out what is wrong. In the past, I had integrated a number of the standard tools directly into the DebugPackages tab of AppV_Manage. For example, there were buttons to run things like a command prompt, or regedit, directly inside the virtual environment so you could look around. Quite often the SysInternals ProcessMonitor tool (ProcMon) is used in debugging, and I previously added a link to run ProcMon (assuming you placed ProcMon somewhere in the “Path” variable) so that you can easily trace file/registry activity while you run the package. Elsewhere in the tool it also monitored and displays the App-V event logs, and even the Debug logs.
But with really difficult issues, sometimes these were not enough. There have been some issues where I needed to resort to using xperf to see what is going on. But clearly xperf is a step beyond what a lot of you are willing to go. So I have added new runtime monitoring support that pulls the most relevant logging from a lot of the sources that I use xperf for, including the normally disabled ETW debug logs and organizes it for an easier to digest form that helps you to understand what is going on.
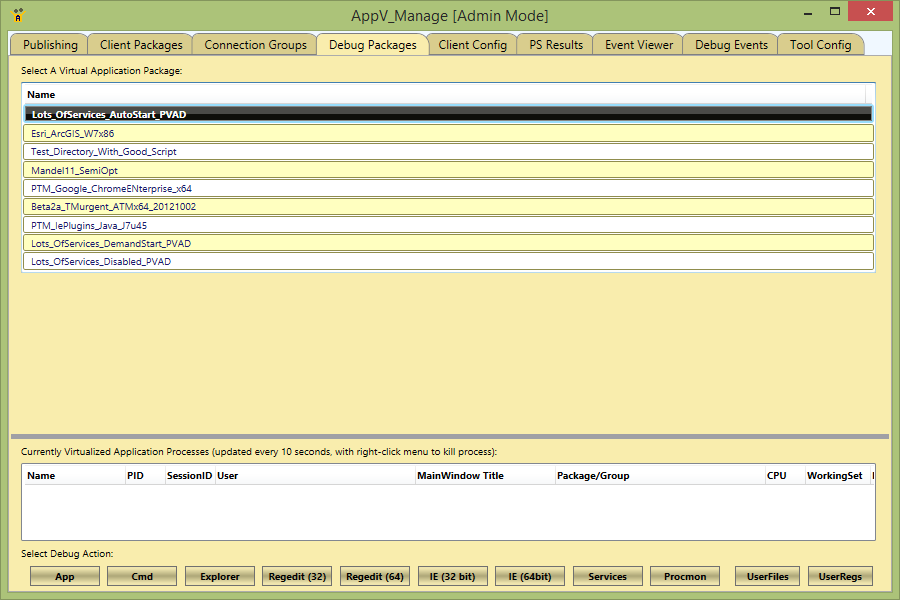
Here is how it works. You install AppV_Manage on the test client and use it to add and publish the package. Then you click on the DebugPackages tab and select your package. At the bottom of the page is the new “App” button.
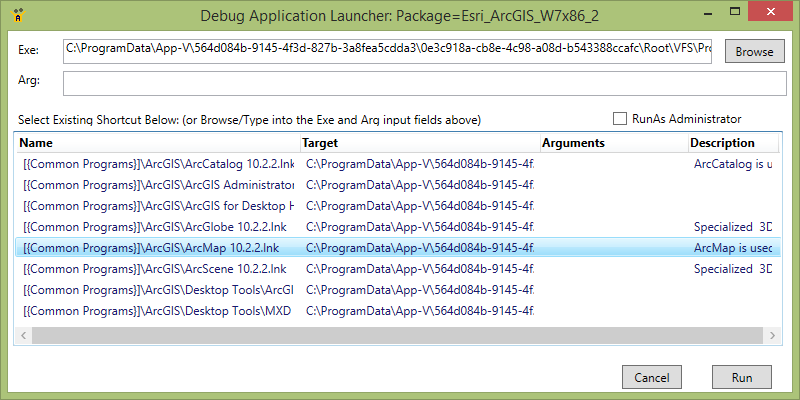
When you click on the App button, a new dialog will appear. This dialog lists all shortcuts associated with the package, and you can select one of these or browse to any executable to run inside the virtual environment. If the shortcut had command line arguments, these are displayed, and you may modify the arguments if needed.
When you click the Run button on the bottom of the screen, you will be presented with the new Runtime monitor. This will enable real-time monitoring of the activity and launch the requested program. The program will be run inside the virtual environment using the App-V client powershell interface (NOTE: Using the powershell interface eliminates issues with /appvve: that some executables cannot handle. The actual shortcuts to external apps use /appvve: )
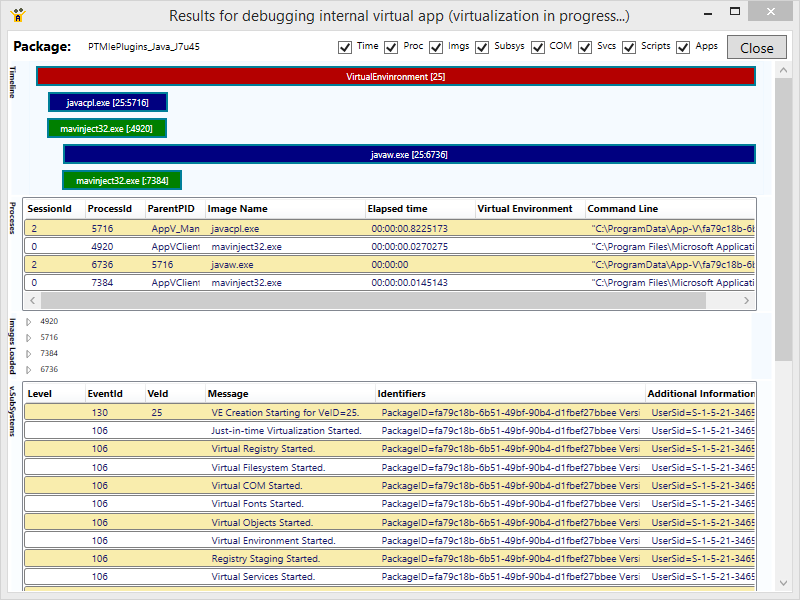
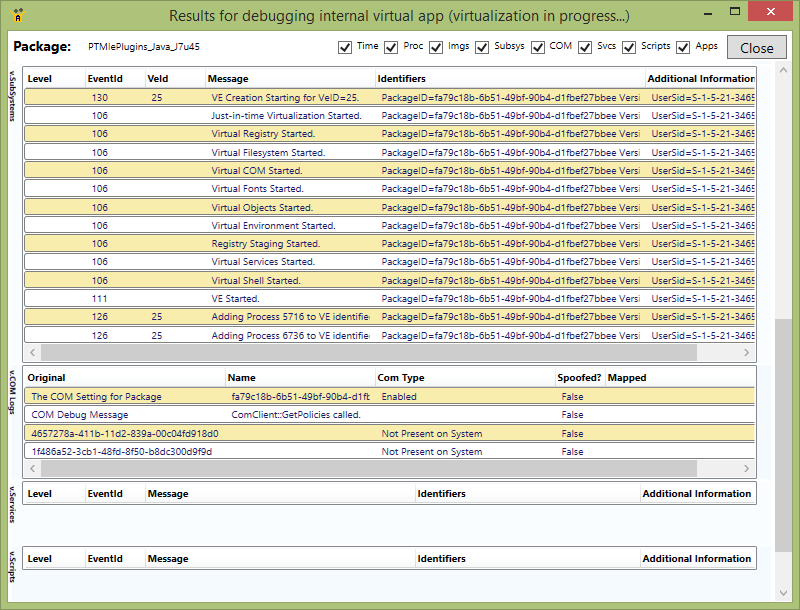
The runtime monitor correlates events that are monitored from a number of sources and has (currently) 8 categories of display, the first four of which are visible in the image above. The checkboxes at the top allow you to hide some of these displays when you aren’t interested in them.
Timeline/Processes/ImageLoads: These three displays focus on the new processes that start while runtime monitoring is used.
The top display shows the processes and App-V virtual environments in a timeline display. Very short lived processes (such as MavInject) are elongated on the timeline from reality or you wouldn’t see them, but actual elapsed time is shown. These are color coded for Virtual Environments (red), virtual processes (blue), and non-virtual processes (green).
The Processes are shows elapsed time for completed processes, the full command line used to start the processes, and other process counters.
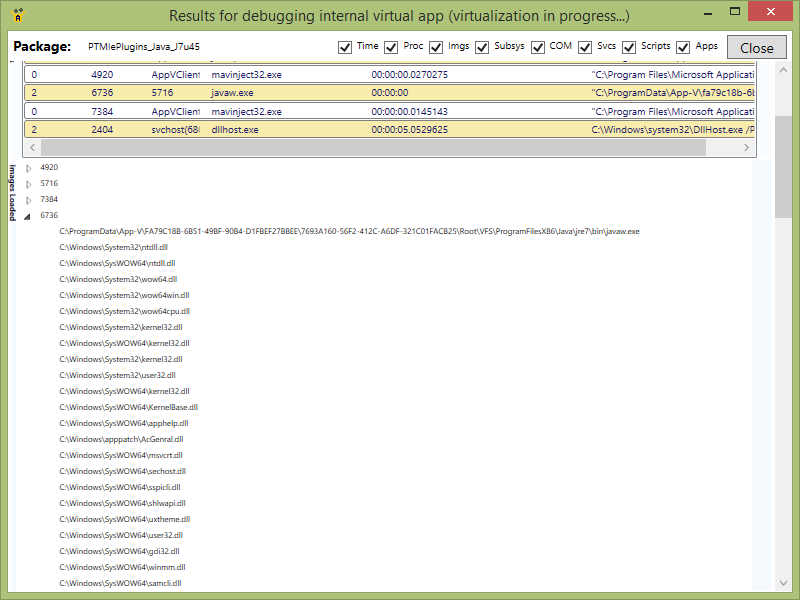
The ImageLoads display details the full path of all loaded dlls by the process.
VirtualSubsystems: This display collects all events about the start and stop of all virtual subsystems, as well as certain errors that may be reported by them.
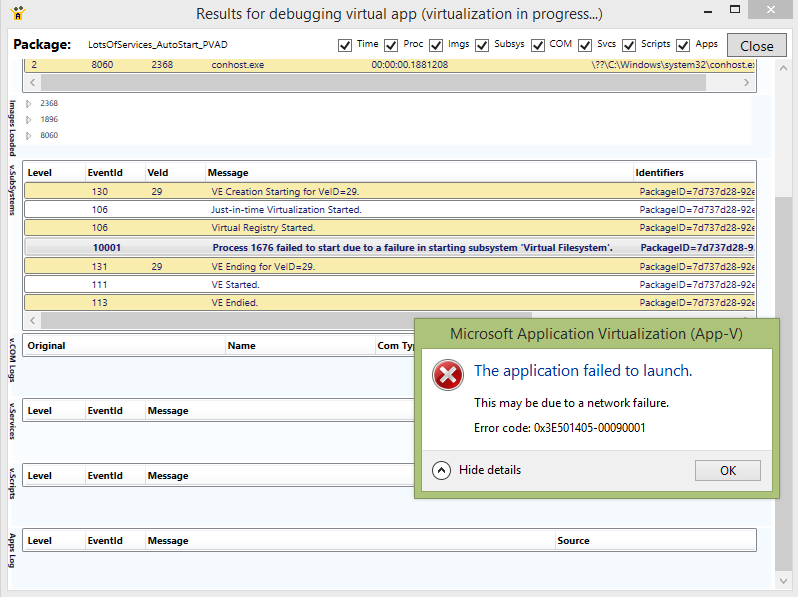
VirtualCOM: Messages involving the virtual COM subsystem are separated out. Unfortunately not all COM activity is logged by the client subsystem, but you can see the COM configuration and some requested COM objects not found. Some standard COM objects, such as the two shown in the display are regularly requested and it is OK for them to not be found.
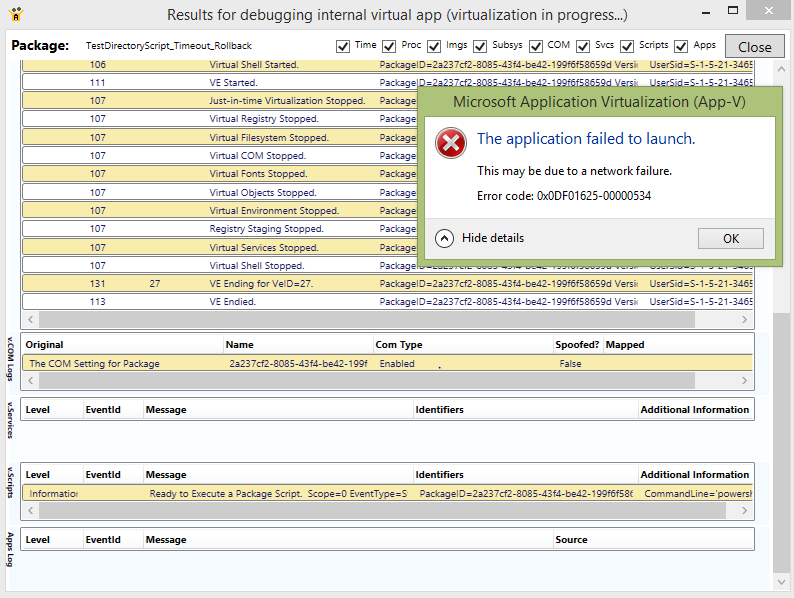
Virtual Scripts: If [start, terminate] [virtual environment, application] scripts are in play, their launch path and arguments are shown. In the image below, we tried to run a package with a start of virtual environment script with rollback enabled while logged in using a Microsoft Account rather than a domain account (App-V can’t run scripts in that case).
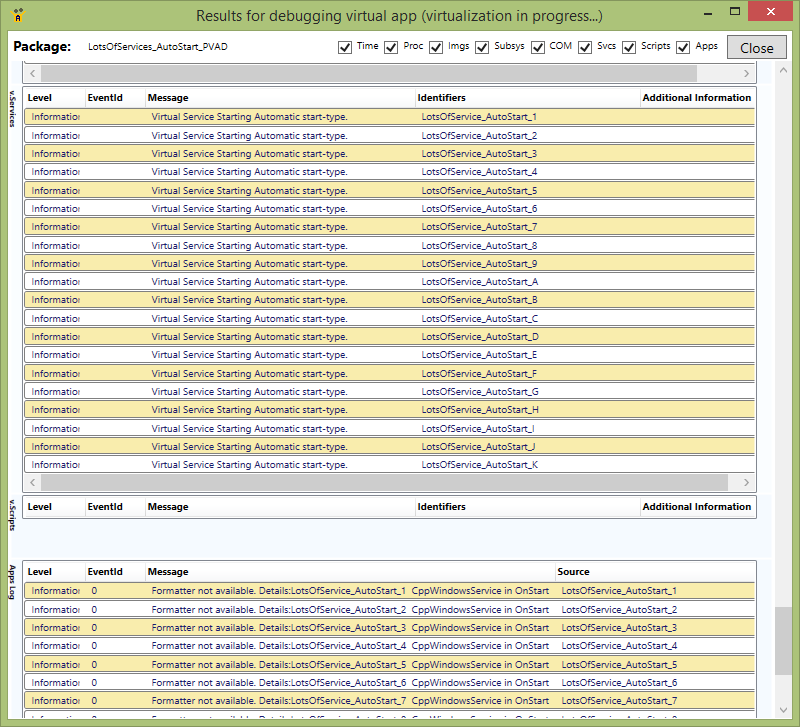
Virtual Services: If virtual services are present, their start/stop activity is shown in the image below (A test app with 20 virtual services):
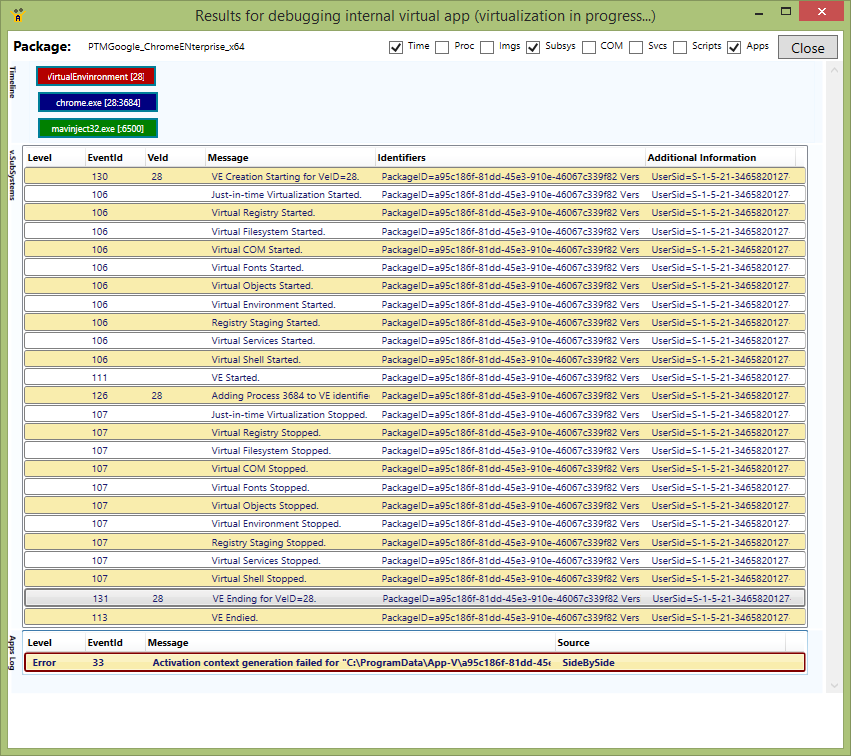
App Log: Sometimes applications write into the standard Windows Application event log. It’s important to remember to check there also, so these are displayed here as well. The package below was generated on a sequencer with a dependent sidebyside assembly not present on the test client, causing the error shown.
 ;
;
I view this runtime debugger as a first attempt. No doubt, with feedback from all of you of situations not well covered yet, we can improve the tool over time. Use the forum on the main TMurgent site to report these situations. I anticipate probably needing to rewrite portions of the debugger due to App-V 5.1 changes when that is released.
Good luck debugging!