At BriForum I gave a presentation on debugging App-V 5. I promised to provide some of the App-V driver analysis of file I/O activity that I showed in the presentation. Here is that detail, with a little bit of explanation.
NOTE: EACH OF THE IMAGES BELOW ARE PDFs. Click on the image to download the PDF for a better view.
App-V 5 uses a new set of file system drivers which are more complex than the original drivers used by SoftGrid and App-V in the past. When something goes wrong with a virtualized application, we often turn to ProcMon to see what is happening, however ProcMon only offers a small glimpse of the activity. Using a trick to alter ProcMon, I have traced out the file accesses made by each layer of the App-V system in some very simple cases. Understanding the purpose of these layers, and using similar traces on virtual application issues may lead to a quicker workaround when problems occur.
For this tracing, I have chosen well known (or special purpose written) applications so that we know what the application would natively request outside of App-V. Unfortunately, each layer needed to be traced in separate runs and manually placed in the accompanying charts, so the relative placement of activity between layers while usually correct, cannot be 100% accurate.
In essence, file and registry access made by the application is affected by the following:
| AppvEnvSubsystems.dll - User Mode injected dll |
| AppVFS.sys - Filter Driver |
| AppvStrm.sys - Filter Driver |
| AppvVeMgr.sys - Filter Driver |
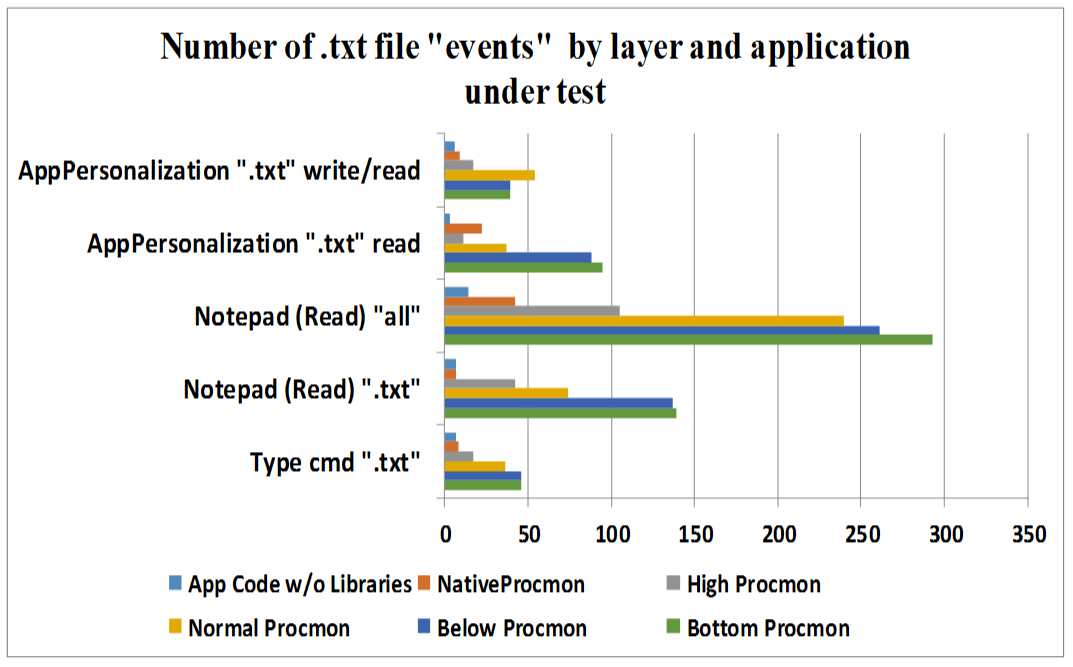
Each call made by the application to the file or registry system will pass through these from the top down. Each layer has it's own purpose, and in general we see the layer adding in additional calls to lower layers to perform its task. For example, the VFS layer might not only look to see if a file exists in the location as requested, but also in several alternate locations inside the package and in locations where user modified versions of the file might be stored. The image below shows the "counts" of file traces at each layer in the tests that follow. Except for the entry labeled with the "All" instead of "Txt", the counts refer to file I/O activity (Irps) traced by procmon related specifically to the file access for the target file. The counts for the "All" entry include everything to launch notepad, open, and read the file.

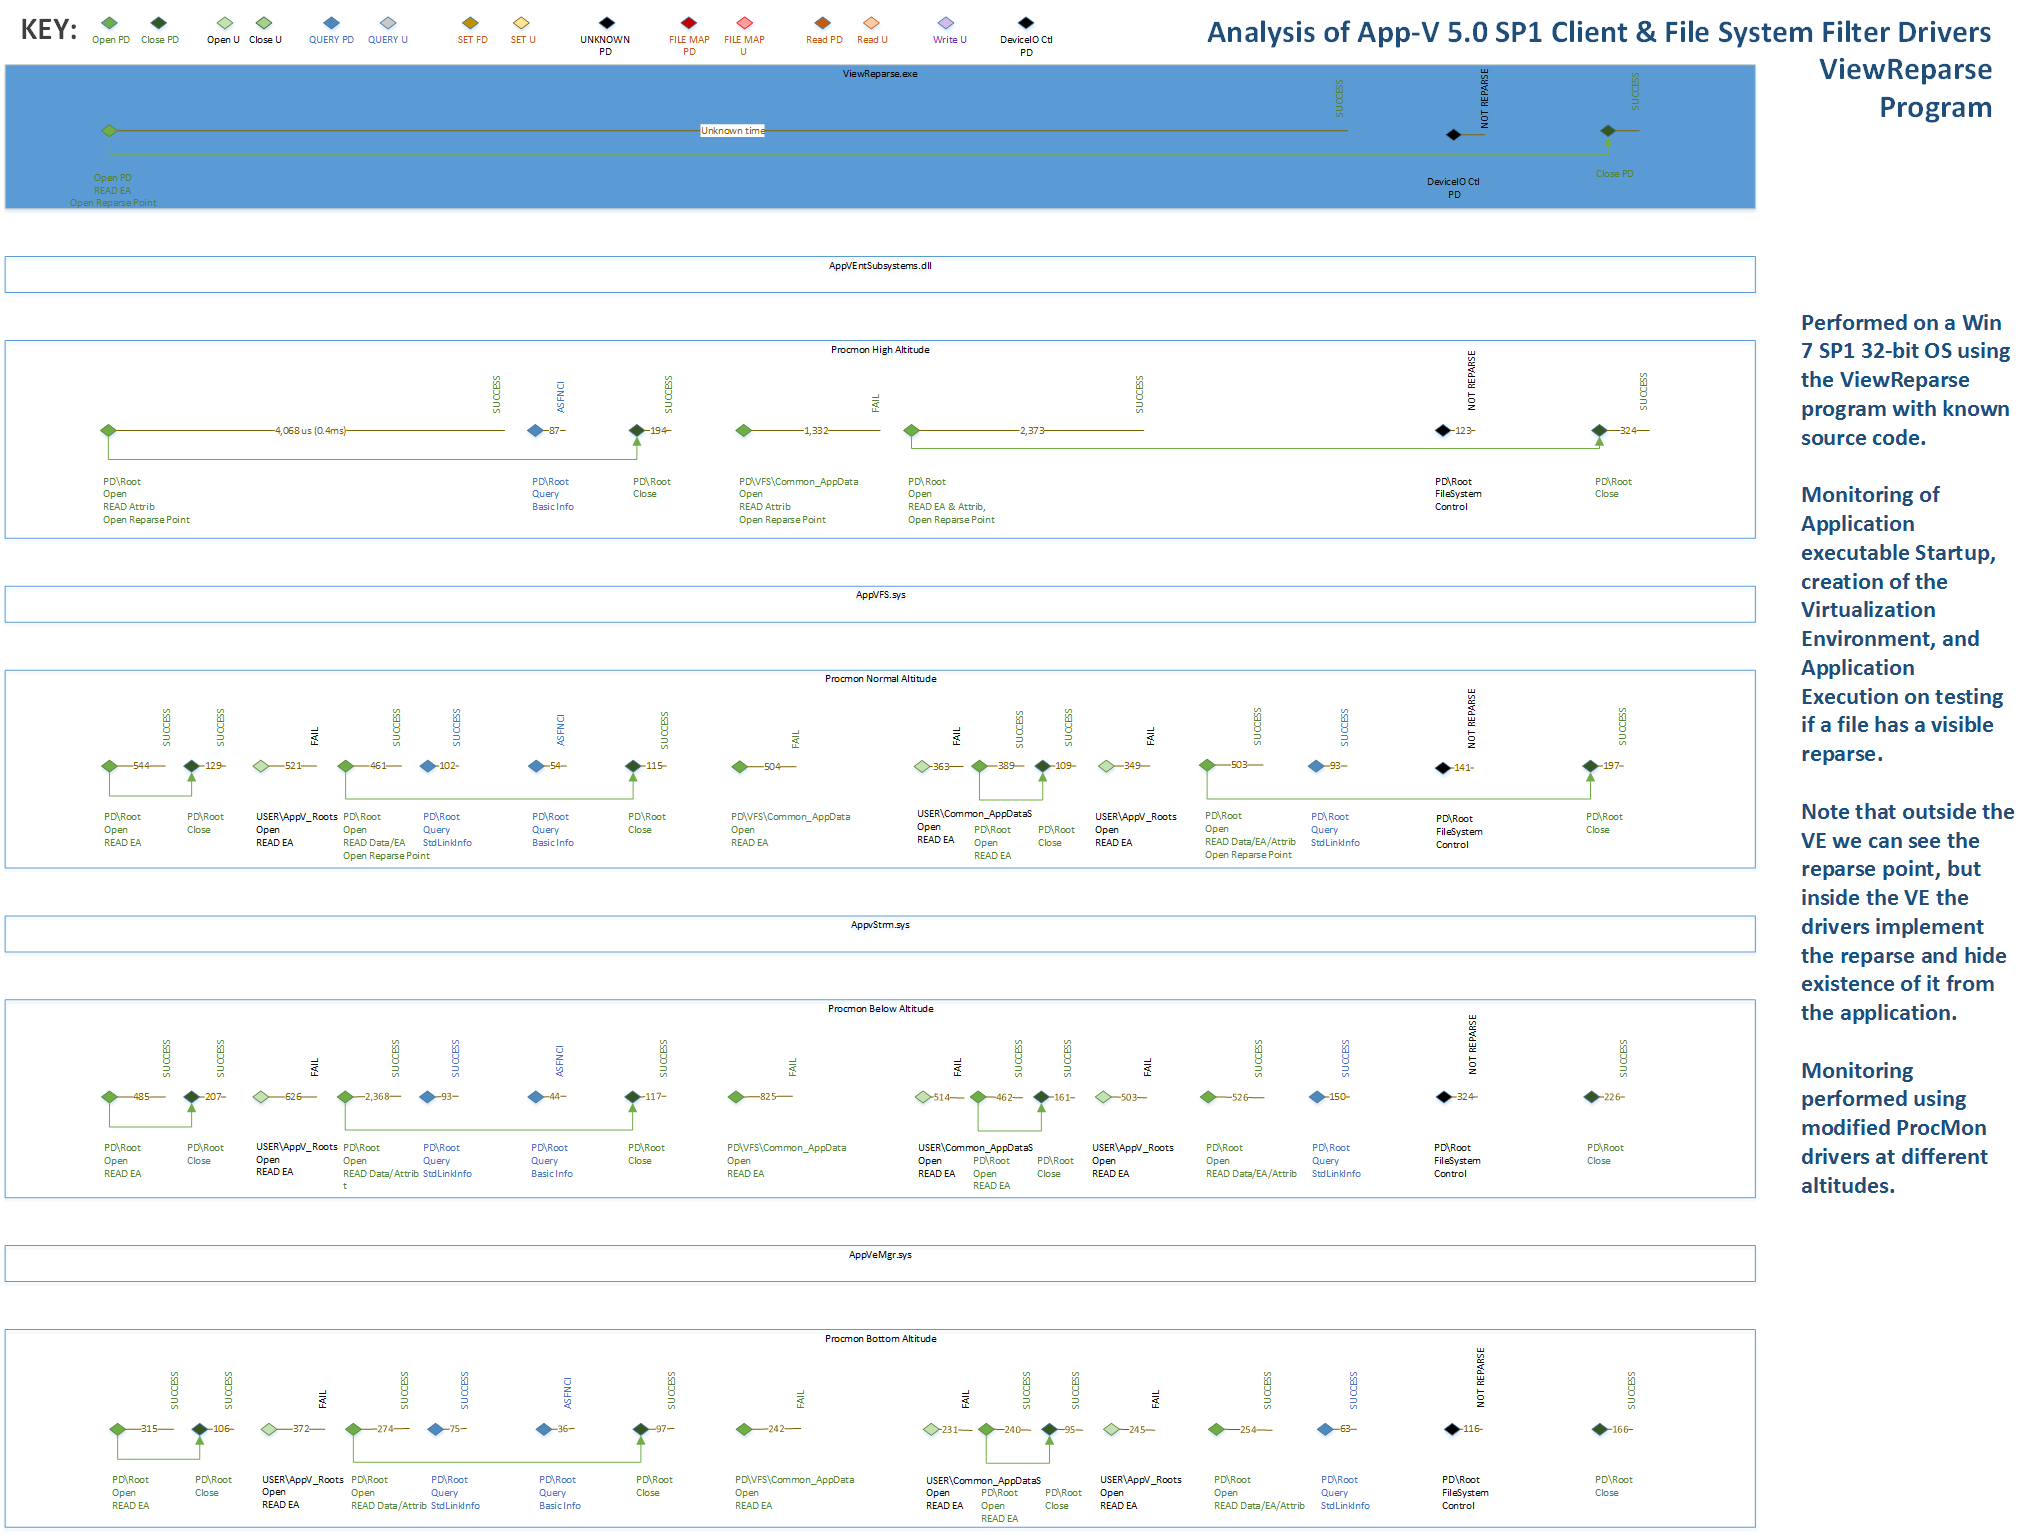
The standard ProcMon trace will trace at a location what is in between the AppVFS and AppvStrm drivers. To trace at a different level, it is necessary to alter the "Altitude" of the ProcMon driver. This may be necessary to "see" the problem.
NOTE: Each of the traces are shown below as small images shrunk to fit the screen. Click on the image for a full sized PDF version.
Type Command
The "Type" command is part of the command shell. It simply locates the requested file, opens it for read purposes (using unmanaged code), and displays it to the screen. This is the simplest case.
Notepad
Notepad is part of the OS. It also locates the requested file and opens it for read purposes, but does so using managed code (.Net) file interfaces which includes file mapping. Interestingly, Notepad only open for read until the modified file is saved, only then does it open for write. The traces below shown only the read activity.
AppPersonalization
AppPersonalization is custom app I wrote to write to specific files in the package. The test shown is the app writing changes to a file that was located in the PVAD folder of the package, obviously redirected to the user appdata area. This app also uses managed code.
Reparse
Reparse is another custom app I wrote. App-V uses custom reparse points to direct the drivers in some cases. This test application attempts to read the reparse point to see what happens.


